Social media. Should there just be one corporate account? And how much of the population should you be reaching to be a success?
by Tom Jennings
I decided to compare the number of followers on Facebook, Twitter and Instagram of all the UK councils - district, city, county, unitary, etc - with a population of 150,000 or more - 175 councils in total.
Yes, I was a little bored that day. But I was also recently told that Oxford City Council has the largest Twitter following, as a percentage of population, of any council in the south of England. I was curious as to whether or not that extended to the whole of the UK. (Spoiler: It doesn’t. By 4.49 percentage points - he said, bitterly.)
I drew the line at a population of 150,000 partly to include Oxford (161,300 population), partly because drawing it at 100,000 would have added another 100+ councils, and partly because it got a bit silly the lower you drew the line (the City of London Corporation, for example, had a Twitter following that was 380.38% of its population).
You can see Tom's full raw data here in a Google sheet.
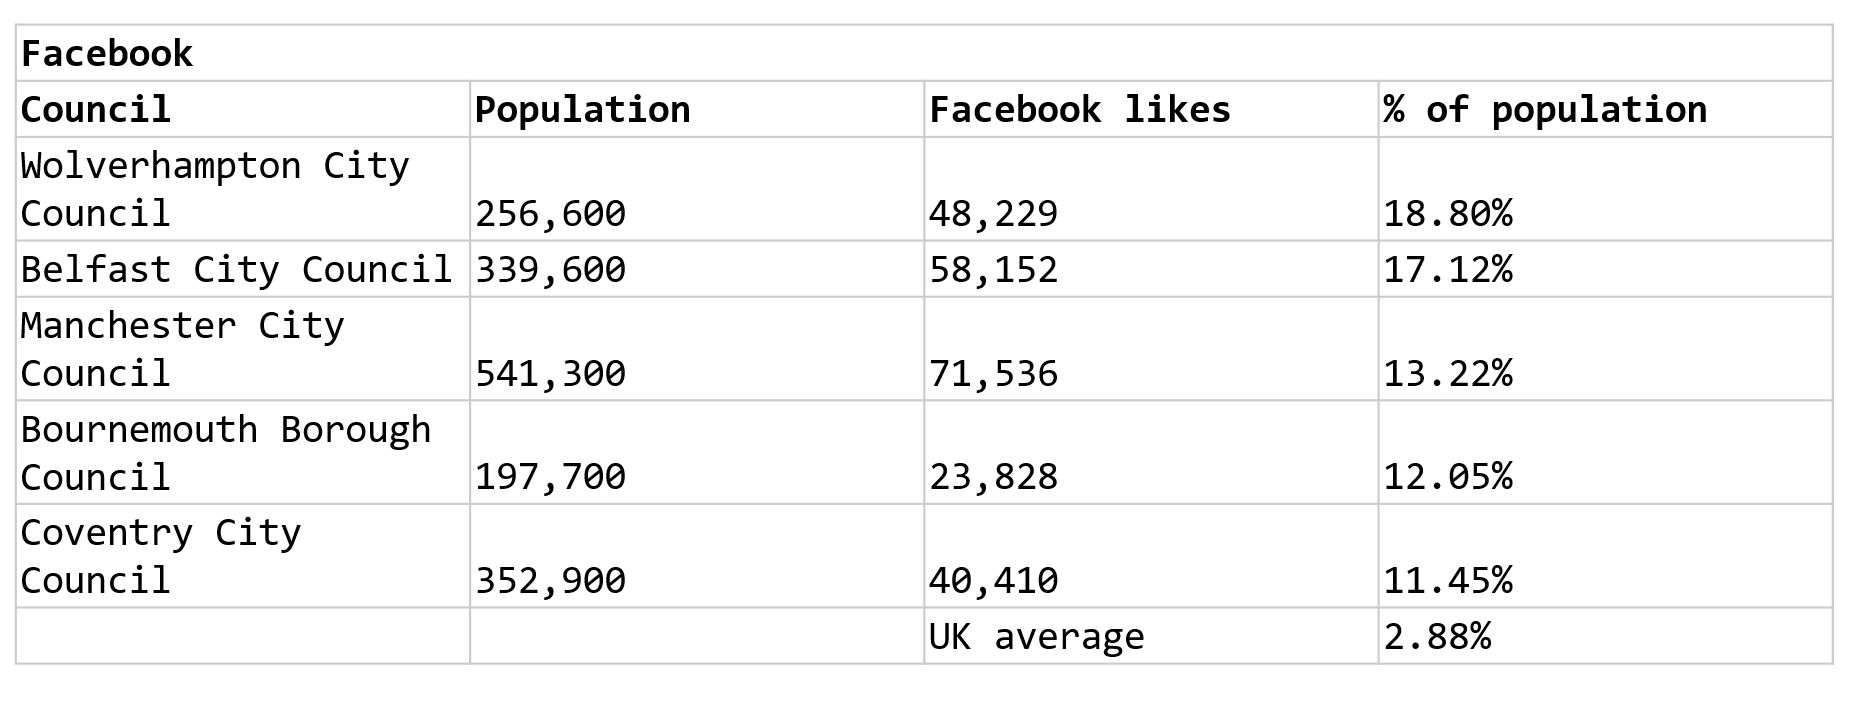
As a percentage of population, here are the top five most-followed Facebook, Twitter and Instagram accounts for councils with a population of 150,000 or more:
If you would like to compare this to your council’s social media following, anything above 8% on Twitter, 3.4% on Facebook and 0.17% on Instagram puts you in the top 50 councils. Hitting the top 10 requires 18% on Twitter, 7.86% on Facebook and 0.51% on Instagram.
What did I learn from doing this? Well, obviously that I probably need a hobby. But also, for councils in Britain, Twitter is still king. Despite Facebook having almost double the audience share of Twitter (73% of UK residents used Facebook and 41% used Twitter in 2017), I found that the vast majority of councils had more followers on Twitter than Facebook (although, interestingly, this wasn’t the case in Northern Ireland, where Facebook dominated). For many councils, the Twitter audience was larger than Facebook by a factor of 10. But for some it was even more pronounced. Liverpool City Council, for example, had 86,459 followers on Twitter but just 878 on Facebook.
Although all 175 councils had an active Twitter account, a few did not have active Facebook pages. Harrogate was the most striking; it only had an unofficial account created automatically by Facebook. Instagram, though, was the most neglected platform. Despite Instagram catching up to Twitter’s audience share (33% of UK residents used Instagram and 41% used Twitter in 2017, compared to 14% for Instagram and 20% for Twitter in 2016), 73 of the 175 councils (41.7%) did not have a corporate Instagram account.
The impression I was left with was that councils took to Twitter first, and then moved to Facebook at a later stage - and then Instagram at a much later stage. This is certainly the case for Oxford City Council (Twitter in 2009, Facebook in 2011, Instagram in 2015). But I also had the impression that, generally, councils put more energy into Twitter than other platforms. However, there were a small number of councils that had a similar number of followers on Twitter and Facebook, giving the impression that they launched both accounts at about the same time - and had put similar energy into both over the years. Wigan Council, for example, had an almost identical 24,027 followers on Twitter and 24,090 likes on Facebook. Personally, this gives me hope that we can substantially grow our Facebook audience (currently we have 44,383 followers on Twitter, but just 11,496 on Facebook).
If you’re looking for councils to follow: Manchester, Belfast and Nottingham dominated across the three platforms. Glasgow’s astonishing 156,160 Twitter followers is also worth noting, though. I was surprised not to see the consistently brilliant comms from Donnington and Newcastle placing them higher. However, the big surprise was seeing Wolverhampton come out on top on Facebook (the council was 82nd on Twitter and 44th on Instagram), but I’d imagine spending about £90,000 on Facebook advertising over the last four years probably helped - and reinforces the case that Facebook is pay-to-play.
The political make-up of the top councils was also an interesting discovery, with the majority being Labour-run administrations. Comparing the top 25 most-followed Twitter accounts, for example, Labour has the largest group on 19 of the councils, with the SNP having the largest group on three, Conservative on two and Sinn Féin on one.
Some of my other findings were: County councils were poorly followed across the board, with city councils making up the vast majority of the top places across all platforms; some councils had strange inconsistencies between account names across platforms, naming their Facebook page something completely different to their Twitter account; handles like @My[name of area] and @Your[name of area] were used frequently; many hadn’t turned off the ability for residents to review their organisations on Facebook; a lot of councils were posting pictures of elves around their offices last week; and, on the whole, council logos are awful. Just awful.
We are keen to map other councils too. If you'd like to add your council's details you can do so on this Google sheet HERE.
Tom Jennings is Senior Communications Officer at Oxford City Council.
Picture credit: OSU / Flickr


