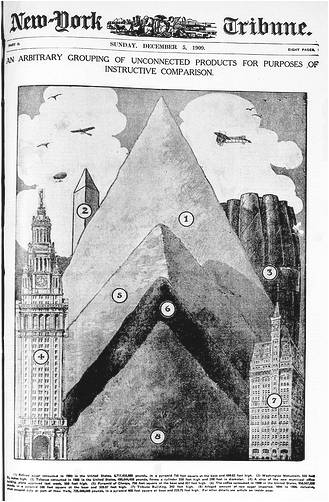
 I've always loved infographics. But are we missing a trick in not using them more often?
The first recorded infographics were early cave drawings.
And infographics have been a constant, creative and brilliantly simple medium guiding, helping and directing us ever since.
They take so many forms, from weather maps to motorway signs.
If you have been abroad this summer then you probably got around just that little bit easier because of infographics. They are universal, they are 'easy-read', they cross boundaries and language.
What's not to like.
So why don't we use them more often in our communications roles?
Yes, I know we all use use them on some level, even if it's something as simple as a graph to show an increase or a decrease in something we're measuring.
But there are so many more creative opportunities offered up by them and maybe it's time we explored and used them a little bit more often.
I wonder if one of the barriers is that some of the the designers we work with don't fully appreciate their communications powers. Or maybe it's because we're all doing so little print these days due to diminishing budgets that the opportunities for them are reducing in equal measure.
It's not like we don't have the material.
We are quite rightly being challenged to open up more and more of the data which our organisations hold but how many people are really using the data well? Of course it's hard to say but my suspicion is that the numbers are low.
So, I'm coming to the conclusion that we comms folk need to do more in terms of presenting this data in a more digestible and mainstream accessile way.
And maybe that's just the excuse we all need to use infographics much more widely in our day jobs.
If you want to know more about infographics there is a cracking article about them on wikipedia
There is also a great post in our archive by the fab Gillian Hudson about her own love of infographics
And if you are struggling to find someone to create your own infographics then give the very talented Caroline Beavon a shout (she's a data journalist who creates these things for fun)
And if you do create one do share them with us.
You can sign-up for our weekly email. You can do that here.
